

Expertise and Technology
For National Security
GET STARTED
Letter to shareholders
To my fellow CACI shareholders,
In a volatile and rapidly changing world, CACI delivered expertise and technology in fiscal year 2024 (FY24) that made a difference to our customers and exceeded our commitments to our shareholders.
We delivered double-digit revenue growth, strong margins, and healthy cash flow. With more than $14 billion in contract awards — including more than $8 billion in new work for the company — CACI grew its backlog by 22%.
These outstanding results are a testament to our successful execution of a consistent, well-defined, and market-aligned strategy. Our strategy of investing ahead of need in differentiated capabilities, bidding less and winning more, focusing on larger and longer duration opportunities, and proactively shaping those opportunities enabled CACI to win significant new work. In addition, our focus on superior execution — which is foundational to our culture — led to on-contract growth, sole-source extensions, and high contract retention through recompetes.
We intentionally align our expertise and technology with enduring and well-funded national security priorities. Our results demonstrate that CACI is in the right markets, delivering high-value, differentiated capabilities — all of which support our ability to grow and deliver value to our customers and shareholders.
Our exceptional performance enabled flexible and opportunistic capital deployment, including executing $150 million in share repurchases and making several tuck-in acquisitions — Quadrint, Inc. in the U.S. and two small companies in the U.K. We continued investing in our talented employees — efforts that were again recognized by prestigious organizations such as Fortune and Forbes naming CACI a “World’s Most Admired Company,” among “America’s Most Innovative Companies,” and a “Best Employer” across multiple categories.
The results of FY24 provide a great foundation for further growth in FY25 and beyond. As is always the case, our success is driven by our employees’ talent, innovation, and commitment, and supported by our culture of ethics and integrity. I want to thank our employees for everything they do to contribute to our company and our nation. I want to thank our customers for their confidence in us. And I want to thank you, our shareholders, for your continued support of CACI.


John S. Mengucci
President
Chief Executive Officer
CACI International Inc
Predictable organic revenue growth
Profitability supportive of continued investment
Efficient management of working capital
and capital expenditures
Flexible and opportunistic capital deployment
Our performance
Revenues ($M)
Net income ($M)
Diluted EPS ($)
Shareholder's equity ($M)
EBITDA1, 2 ($M)
Adjusted net income2 ($M)
Adjusted EPS2 ($)
Free cash flow2 ($M)
Income statement data
(in thousands, except per share data and percentages)
| Year ended June 30 | 2024 | % Change | 2023 |
|---|---|---|---|
| Revenues | $7,659,832 | 14.3% | $6,702,546 |
| Operating income | $649,708 | 14.5% | $567,500 |
| Net income | $419,924 | 9.1% | $384,735 |
| Diluted earnings per share | $18.60 | 13.2% | $16.43 |
| Weighted-average diluted shares | 22,573 | 23,413 |
Balance sheet data
(in thousands, except percentages)
| Year ended June 30 | 2024 | % Change | 2023 |
|---|---|---|---|
| Total assets | $6,796,101 | 3.0% | $6,600,808 |
| Working capital | $296,269 | 37.1% | $216,066 |
| Shareholder's equity | $3,518,207 | 9.1% | $3,224,334 |
There are statements made herein which reflect our intent, belief, or current expectations and do not address historical facts. Such statements could be interpreted to be forward-looking statements within the meaning of federal securities laws.
Please refer to CACI’s Annual Report on Form 10-K as well as other filings with the SEC, for a description of the substantial risks and uncertainties related to the forward-looking statements included herein.
1 FY20 was defined as Adjusted EBITDA.
2 This non-GAAP measure should not be considered in isolation or as a substitute for measures prepared in accordance with GAAP. For additional information regarding this non-GAAP measure, see the related explanation and reconciliation to the GAAP measure on the Reconciliation of Non-GAAP Measures section of this Annual Report.
Our vision
Be the ever vigilant partner that national security customers depend upon to overcome their greatest challenges.
Provide differentiated expertise and technology at the speed of change in markets that matter.
Distinguish CACI as a team of professionals committed to doing the right thing by performing with good character, ethics, and integrity.
Be the place where talent comes to drive the future of national security.
Through a well-defined and articulated strategy, deliver better than fair market returns to investors.
Our market-based approach
We understand that the national security landscape is ever changing. True to our long-standing and highly-trusted brand, CACI remains ever vigilant by offering differentiated expertise and innovative technology at the speed of change to meet the most difficult challenges head on. We compete in seven markets where our impact spans from the desktop to the tactical edge — with capabilities to meet the multitude of complexities in between.


Our business in action
In FY24, our Agile-at-scale software development methodologies resulted in enterprise mission success for government operations by empowering our customers to meet modern challenges. For example, through our work with NASA on the Consolidated Applications and Platform Services program, we are standardizing and centralizing software development by providing stakeholders with timely, accurate, relevant information. Similarly, we are building on 20 years of enabling mission agility and adaptability by continuing to provide language analysis and expertise to an Intelligence Community customer, strengthening foreign intelligence missions.
At the frontlines, CACI plays a leading role in winning the fight in electromagnetic spectrum dominance through signals detection, direction finding, electronic attack, and associated intelligence activities at the tactical edge. We are also leaders in force protection with proven counter-uncrewed systems (C-UxS) technologies.
Beyond the tactical edge, we are protecting our customers by securing their data and information without compromising productivity. We continue to reap the benefits of our investments in network modernization through significant enterprise IT programs for customers like the U.S. Army, U.S. European Command, and U.S. Africa Command. By utilizing Commercial Solutions for Classified and advanced cybersecurity technologies, we strengthen the resiliency of network operations and improve critical hardware and software life cycle performance.
We believe in leveraging space as the final frontier to push the boundaries of how our customers use information to advance their missions. That’s why we stretched what is possible with our technologies, demonstrating the interoperability of our optical communications terminals to create a high-volume data transport system in Earth’s orbit. We also made history with NASA, establishing optical communications with a probe over a distance of more than 200 million kilometers in deep space. We continue to deploy advanced capabilities that fuel space superiority and multi-domain operational success.
11KMILITARY AND CIVILIAN PERSONNEL
SUPPORTED BY OUR ENTERPRISE IT
EFFORTS ACROSS 60 LOCATIONS IN EUROPE AND AFRICA
800KEND USERS BENEFITTING
FROM CACI’S IT
SERVICE MANAGEMENT
ACROSS GOVERNMENT
200NASA IT SYSTEMS
TO BE CONSOLIDATED
INTO ONE PROGRAM
Investing ahead of need
CACI’s enduring strategy of investing ahead of need is the engine that drives our innovation. As we advance to FY25 and beyond, we will continue to align our business to customer demand and the constantly evolving global threat environment.
To support our customers’ highest priorities, we are positioned to address their current and future challenges by shouldering investments in key focus areas, including:
Network Modernization
As evidenced by our strong FY24 awards, CACI is a dominant force in network modernization. With success stories writing themselves at multiple government agencies, we deliver superior user experiences across the board while achieving— and often beating—delivery timelines and milestones. While each program has its own nuances, we invest in and foster the leading experts who know exactly how to upgrade, secure, enhance, and drive network efficiencies. The bottom line is that CACI enhances enterprise performance more quickly and effectively than our competitors, and we intend to continue doing so.
Software Development
CACI manages three multi-billion dollar software development programs across the U.S. government. Our teams of Agilists are unmatched in their impressive, iterative knowledge of software development methodologies. Our commitment to open architecture, software-defined technology drives innovation, continuous improvement, and new capabilities at a rapid pace. We continue to invest in the expertise and technology that maintain our position as a leader in software development so that we can dynamically deliver the outcomes our customers demand.
Electromagnetic Spectrum
Actionable intelligence needs to be more prescient than ever before. For more than a decade, our sustained investment in developing and deploying cutting-edge technologies has provided the U.S. with spectrum advantage around the world. CACI’s electromagnetic spectrum portfolio meets a growing demand for robust, multi-domain, modular, and integrated tactical applications. As uncrewed systems and drones reshape the battlefield, this investment continues to evolve rapidly into form factors and on platforms that our armed forces need to defeat global threats.
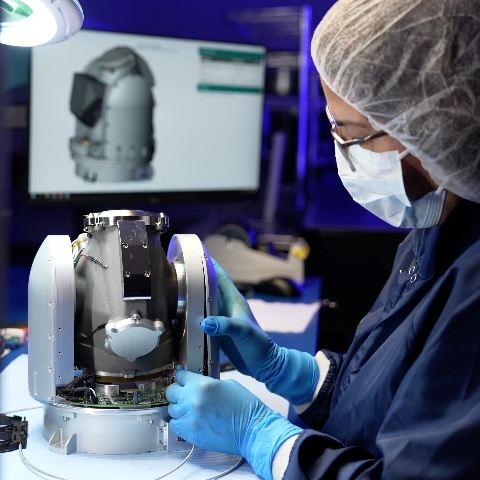
Photonics
American-engineered and -made photonics technology advances our nation’s security in the highly contested space domain. Our strategic investment in this business has made it the most reliable and lowest risk optical communications technology facilitating secure communications across a breadth of orbits and operations today. Government and defense industry customers rely on our proven success for their critical missions across all orbits and into deep space. Going forward, we will continue to combine research, development, and innovation with scaled manufacturing to meet growing demand.
200M+NUMBER OF KILOMETERS
FROM SPACE PROBE TO EARTH
FOR SUCCESSFUL OPTICAL
TRANSMISSION OF DATA
27NUMBER OF DEPLOYED AND
OPERATIONAL OPTICAL
COMMUNICATIONS TERMINALS
IN LOW-EARTH ORBIT
Our people
Our people are our greatest asset. Our company’s success is driven by our 24,000 employees’ limitless talent, innovation, and commitment, and is enabled by our culture of ethics and integrity. We win work with the best talent possible because we offer boundless opportunities for our employees to serve their country, grow their skills, and expand their horizons. Each of our employees — including our hundreds of summer interns — are given the autonomy to succeed, the resources to thrive, and the opportunity to break new ground. We believe in providing dynamic careers that inspire our employees to shape the future of national security.
Awards and recogntion

seven consecutively

consecutively

consecutively


Summary of U.K. operations
CACI’s business in the U.K. generated another year of record revenue and net income from offices and programs throughout Europe and Asia.
In FY24, we helped safeguard the U.K. by providing key solutions for secure government organizations, such as a crucial system for the U.K. Home Office that ensures the protection and efficient operation of the U.K. border. We also delivered rapid software development for Gold Standard, an international non-government organization, to uphold environmental integrity in global carbon emission reduction projects. Additionally, we developed a real-time communications program for easyJet, a European airline.
This year’s strategic acquisitions informed the digital transformation and software engineering capabilities for government, defense, and commercial customers. Looking forward, we will continue to focus on investments in proprietary products, data solutions, and distinctive expertise that differentiate and expand our capabilities and global presence.

Our Board of Directors

(Chairman)


U.S. Navy (Ret.)


U.S. Army (Ret.)
About CACI
At CACI International Inc (NYSE: CACI), our 24,000 talented and dynamic employees are ever vigilant in delivering distinctive expertise and differentiated technology to meet our customers’ greatest challenges in national security. We are a company of good character, relentless innovation, and long-standing excellence. Our culture drives our success and earns us recognition as a Fortune World’s Most Admired Company. CACI is a member of the Fortune 1000 Largest Companies, the Russell 1000 Index, and the S&P MidCap 400 Index. For more information, visit us at caci.com.
Additional information
FY 2024 10-K
Proxy Statement
FY 2024 Q4 and Full Year
Earnings Release
Download PDF

Reconciliation of Non-GAAP measures
Reconciliation of Net Income to Adjusted Earnings Before Interest, Taxes, Depreciation and Amortization (EBITDA)
The Company views Adjusted EBITDA and Adjusted EBITDA margin, both of which are defined as non-GAAP measures, as important indicators of performance, consistent with the manner in which management measures and forecasts the Company’s performance. Adjusted EBITDA is a commonly used non-GAAP measure when comparing our results with those of other companies. We define Adjusted EBITDA as GAAP net income plus net interest expense, income taxes, depreciation and amortization expense (including depreciation within direct costs), and earnout adjustments. We consider Adjusted EBITDA to be a useful metric for management and investors to evaluate and compare the ongoing operating performance of our business on a consistent basis across reporting periods, as it eliminates the effect of non-cash items such as depreciation of tangible assets, amortization of intangible assets primarily recognized in business combinations, as well as the effect of earnout gains and losses, which we do not believe are indicative of our operating performance. Adjusted EBITDA margin is adjusted EBITDA divided by revenue. These non-GAAP measures should not be considered in isolation or as a substitute for performance measures prepared in accordance with GAAP.
| (in thousands) | |
|---|---|
| 6/30/2020 | |
| Net income | $321,480 |
| Plus: | |
| Income taxes | 80,157 |
| Interest income and expense, net | 56,059 |
| Depreciation and amortization expense, including amounts within direct costs | 112,889 |
| Earnout adjustments | 3,000 |
| Adjusted EBITDA | $573,585 |
| (in thousands) | |
|---|---|
| 6/30/2020 | |
| Net income | $5,720,042 |
| Adjusted EBITDA | 573,585 |
| Adjusted EBITDA margin | 10% |
Reconciliation of Net Income to Earnings Before Interest, Taxes, Depreciation and Amortization (EBITDA)
The Company views EBITDA and EBITDA margin, both of which are defined as non-GAAP measures, as important indicators of performance, consistent with the manner in which management measures and forecasts the Company’s performance. EBITDA is a commonly used non-GAAP measure when comparing our results with those of other companies. We define EBITDA as GAAP net income plus net interest expense, income taxes, and depreciation and amortization expense (including depreciation within direct costs). We consider EBITDA to be a useful metric for management and investors to evaluate and compare the ongoing operating performance of our business on a consistent basis across reporting periods, as it eliminates the effect of non-cash items such as depreciation of tangible assets, amortization of intangible assets primarily recognized in business combinations, which we do not believe are indicative of our operating performance. EBITDA margin is EBITDA divided by revenue. These non-GAAP measures should not be considered in isolation or as a substitute for performance measures prepared in accordance with GAAP.
| (in thousands) | Twelve Months Ended | |||
|---|---|---|---|---|
| 6/30/2024 | 6/30/2023 | 6/30/2022 | 6/30/2021 | |
| Net income | $419,924 | $384,735 | $366,794 | $457,443 |
| Plus: | ||||
| Income taxes | 124,725 | 98,904 | 87,778 | 42,172 |
| Interest income and expense, net | 105,059 | 83,861 | 41,757 | 39,836 |
| Depreciation and amortization expense, including amounts within direct costs | 148,293 | 148,482 | 141,179 | 129,131 |
| EBITDA | $798,001 | $715,982 | $637,508 | $668,582 |
| (in thousands) | Twelve Months Ended | |||
|---|---|---|---|---|
| 6/30/2024 | 6/30/2023 | 6/30/2022 | 6/30/2021 | |
| Revenues, as reported | $7,659,832 | $6,702,546 | $6,202,917 | $6,044,135 |
| EBITDA | 798,001 | 715,982 | 637,508 | 668,582 |
| EBITDA margin | 10.4% | 10.7% | 10.3% | 11.1% |
Reconciliation of Net Income to Adjusted Net Income and Diluted EPS to Adjusted Diluted EPS (Unaudited)
Adjusted net income and Adjusted diluted EPS are non-GAAP performance measures. We define Adjusted net income and Adjusted diluted EPS as GAAP net income and GAAP diluted EPS, respectively, excluding intangible amortization expense and the related tax impact as we do not consider intangible amortization expense to be indicative of our operating performance. We believe that these performance measures provide management and investors with useful information in assessing trends in our ongoing operating performance, provide greater visibility in understanding the long-term financial performance of the Company, and allow investors to more easily compare our results to results of our peers. These non-GAAP measures should not be considered in isolation or as a substitute for performance measures prepared in accordance with GAAP.
| (in thousands, except per share data) | Twelve Months Ended | ||||
|---|---|---|---|---|---|
| 6/30/2024 | 6/30/2023 | 6/30/2022 | 6/30/2021 | 6/30/2020 | |
| Net income, as reported | $419,924 | $384,735 | $366,794 | $457,443 | $321,480 |
| Intangible amortization expense | 73,776 | 75,426 | 74,133 | 67,501 | 59,273 |
| Tax effect of intangible amortization1 | (18,640) | (19,236) | (19,199) | (17,748) | (15,585) |
| Adjusted net income | $475,060 | $440,925 | $421,728 | $507,196 | $365,168 |
| (in thousands, except per share data) | Twelve Months Ended | ||||
|---|---|---|---|---|---|
| 6/30/2024 | 6/30/2023 | 6/30/2022 | 6/30/2021 | 6/30/2020 | |
| Diluted EPS, as reported | $18.60 | $16.43 | $15.49 | $18.30 | $12.61 |
| Intangible amortization expense | 3.27 | 3.22 | 3.13 | 2.70 | 2.33 |
| Tax effect of intangible amortization1 | (0.82) | (0.82) | (0.81) | (0.71) | (0.61) |
| Adjusted diluted EPS | $21.05 | $18.83 | $17.81 | $20.29 | $14.33 |
1 Calculation uses an assumed full year statutory tax rate of 25.3%, 25.5%, 25.9%, 26.3%, and 26.3% on non-GAAP tax deductible adjustments for June 30, 2024, 2023, 2022, 2021 and 2020, respectively.
Reconciliation of Net Cash Provided by Operating Activities to Net Cash Provided by Operating Activities Excluding MARPA and to Free Cash Flow (Unaudited)
The Company defines Net cash provided by operating activities excluding MARPA, a non-GAAP measure, as net cash provided by operating activities calculated in accordance with GAAP, adjusted to exclude cash flows from CACI’s Master Accounts Receivable Purchase Agreement (MARPA) for the sale of certain designated eligible U.S. government receivables up to a maximum amount of $250.0 million. Free cash flow is a non-GAAP liquidity measure and may not be comparable to similarly titled measures used by other companies. The Company defines Free cash flow as Net cash provided by operating activities excluding MARPA, less payments for capital expenditures. The Company uses these non-GAAP measures to assess our ability to generate cash from our business operations and plan for future operating and capital actions. We believe these measures allow investors to more easily compare current period results to prior period results and to results of our peers. Free cash flow does not represent residual cash flows available for discretionary purposes and should not be used as a substitute for cash flow measures prepared in accordance with GAAP.
| (in thousands) | Twelve Months Ended | ||||
|---|---|---|---|---|---|
| 6/30/2024 | 6/30/2023 | 6/30/2022 | 6/30/2021 | 6/30/2020 | |
| Net cash provided by operating activities | $497,331 | $388,056 | $745,554 | $592,215 | $518,705 |
| Cash used in (provided by) MARPA | (50,000) | (42,215) | 24,242 | 17,973 | (7,473) |
| Net cash provided by operating activities excluding MARPA | 447,331 | 345,841 | 769,796 | 610,188 | 511,232 |
| Capital expenditures | (63,686) | (63,717) | (74,564) | (73,129) | (72,303) |
| Free cash flow | $383,645 | $282,124 | $695,232 | $537,059 | $438,929 |